

Let us look at a few examples to better understand the power of compounding and its implications to financial planning. We will start with a simple goal of saving up Rs30 Lakhs in 25 years. This could be a financial goal that you take up to fund your retirement, or maybe plan for your child's higher education. Assuming a 12% annual rate of return, you would need to invest Rs20090 annually to achieve this goal. So far this is just basic mathematics, and is the kind of computation any financial planner, or online financial calculator can do for you. Here is a pictorial representation of how the corpus would grow over the 25 years, finally reaching a value of Rs30 Lakhs at the end of the 25th year.

Now here are some interesting observations that are a direct result of the nature of compounding. I have labeled them as Compound Interest Observations (or CIOs)
CIO1: The first thing I'd like you to notice is how exactly your total corpus grows over time. The exponential nature of the curve above leads to some interesting results in terms of the rate of growth of your corpus over time. This result may not be very evident when you look at the above curve, so let me show you the same curve in percentage terms below.

First lets focus on the red line at the mid-point of your 25 year investment plan. At the 12.5 year mark, your corpus only amounts to 20% of your final savings goal! So even though you have completed 50% of your investment timeline, you have only achieved 20% of your investment goal! Next lets focus on the second red line at the 20 year mark. At the 20 year mark you have completed four-fifths or 80% of your investment timeline, and still your corpus has only reached a little over 50% of your savings target. It is only in the last 5 years that the power of compounding really kicks in and catapults your investment to the final 100% target. The key takeaway here is that even though you are steadily investing Rs20000 annually, and the rate of return is also a steady 12% annually, the corpus growth is heavily weighted to the later portion of your savings timeline. In the early years a very small amount of the corpus will be built up, while towards the end as you near your goal, the corpus grows rapidly. This simple effect has profound implications on the impact of variations in investment ability, or investment return on the final corpus accumulated. As a case-study, this example clearly reveals why many people get frustrated with their savings progress. In the early stages of savings, the corpus growth is much slower (20% corpus in 50% time, 50% corpus in 80% time) and it is only much later that you can finally start seeing the magic effect of compounding. This effect many times leads to people giving up on their savings goals, since they are not able to see a proportionate increase in their corpus for the effort they put in (in the form of annual investments) during the early years. However, this example clearly shows that you need the patience to complete your investment timeline, to truly reap the rewards of compounding.
CIO2: The next point to closely observe is the yearly increase in your corpus. I have plotted the yearly increments in the total corpus for this example below.
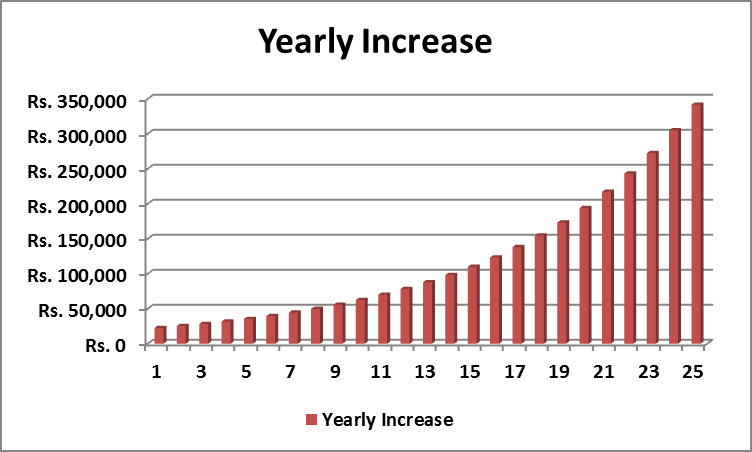
Notice that in the first few years the annual increase is only around Rs20,000 to Rs40,000 per year. Whereas after the 15th year, the corpus grows by more than Rs1 Lakh per annum. This just reinforces the observation from the previous case wherein the rate of growth is hardly worth mentioning in the initial years, but the yearly increase is spectacular in the last few years of your investment timeline.
CIO3: Next lets look at how the yearly growth that is described above, is actually achieved. In the plot below, I show 2 lines. The blue line is the percentage contribution of your own investment to the yearly increase above (remember you are putting in Rs20K every year which will show up as an increase in corpus every year, but is really your own money) and the red line is the percentage contribution from the investment returns (at 12% per annum) to the yearly increase.

Observe that in the first 3 years, over 70% of the yearly increase is coming from your own investment adding up to the corpus. The increase from investment returns is less than 30% in each of the first 3 years. This is why it is so critical to continue with your investment plans in long range products like ULIPs and insurance endowment policies well beyond 3years, since in the first 3 years, most of the "growth" is really your own money being returned to you. The cross-over occurs at the 6th year in this example, where both your investment of Rs20K and the investment returns are almost the same. Beyond this point, the investment returns steadily keep increasing and from the 20th year onwards, account for more than 90% of the yearly growth. At this time, your yearly investment of Rs20K becomes negligible since almost all of the yearly growth is powered by investment returns.
CIO4: The final observation I will make in this article is to drive home the point from CIO3. The graph below shows the percentage of your money (the annual Rs20K that you are investing) in the actual corpus that is available every year.

You will notice again that in the initial few years the percentage of your money in the total corpus is high. For example at the end of the 3rd year, ~80% of the total available corpus is your own money! (the Rs60K that you have invested in the first 3 years) Investment returns at the end of the 3rd year form only 20% of the overall corpus. Even after 10 long years, the total corpus comprises only 50% of investment returns with the remaining 50% being your own investment money. This again highlights the need to stay invested in long range products almost to the end of their lifetime, since during the early stages most of the corpus is your own money, with a low percentage of investment return based money.
I hope this article sheds some additional light on how compounding actually works, and allows you to better envision some of the implications of the way compounding grows your investments. No wonder Albert Einstein said "Compound Interest is the 8th wonder of the world. He who understands it ... earns it ... He who doesn't ... pays it"
No comments:
Post a Comment